))
Pipelines, PowerBI and Price Indexes
Manage episode 442899102 series 2805499
Το περιεχόμενο παρέχεται από το Mean, Median, and Moose. Όλο το περιεχόμενο podcast, συμπεριλαμβανομένων των επεισοδίων, των γραφικών και των περιγραφών podcast, μεταφορτώνεται και παρέχεται απευθείας από τον Mean, Median, and Moose ή τον συνεργάτη της πλατφόρμας podcast. Εάν πιστεύετε ότι κάποιος χρησιμοποιεί το έργο σας που προστατεύεται από πνευματικά δικαιώματα χωρίς την άδειά σας, μπορείτε να ακολουθήσετε τη διαδικασία που περιγράφεται εδώ https://el.player.fm/legal.
This month on Mean, Median, and Moose, geeking out on tools.
Creating a dashboard of LCBO Top 20’s with Observable Framework
By John Haldeman
For my tool, I picked the Observable Framework. This is an interesting cross between a static website generator and Observable’s JavaScript notebooks. Framework has a good getting started guide that will get you the feel for how this works.
First you need some data to populate your data application. I chose an interesting project called LCBO stats. This project is an open source API which gets its data by scraping the LCBO website. You can then use the API to get rankings of LCBO products. From there you can look up their pricing history. Pretty cool!
To extract the data from LCBO stats, I created a simple data loader which is just a little script that outputs a data file – in this case formatted as JSON. We’ll use a “FileAttachment” API later to have Observable Framework automatically execute this script and insert the data into the website. What’s interesting and unique about this is that the Observable Framework supports data loaders in a variety of languages. All you need is a simple program to get the data and dump it to standard out. My data loader takes two parameters, field (to specify what to rank by) and sort (to specify ascending or descending order), so that I can use a single one for all of my charts. I didn’t do any aggregations because the API doesn’t support it and I didn’t want to programmatically page through all the results and do the aggregations myself, because that would be a rude thing to do with a free public API (ie: use a bunch of resources to dump all the data available).
I then displayed the data using a sort of “Markdown file on steroids” which the Observable Framework excels at. This includes a markdown header to specify the themeing and other options. A JavaScript block to retrieve the data and a block to display the data using Observable Plot. Finally you just insert the results from the JavaScript calls into some HTML.The ergonomics of this are amazing. No tagging HTML tags with IDs and telling the chart framework to dump the data there. The code and the presentation mix effortlessly. Traditionally that’s a bad idea, but the notebook-like nature of these definitions means that you can create complicated things and they’re still easy to understand.
And here’s the end result: https://johnhaldeman.observablehq.cloud/lcbo-top-20s/

Data Pipeline Demo
By Doug Sartori
Many people use Python for data transformation. Python libraries like PETL and pandas provide many of the tools needed for one-shot data analysis and transformation work. Data notebooks provide interactivity and make for a pretty compelling set of tools for data professionals.
We’ve talked a lot about those tools on this show, which makes sense because they’re the basic tools you need to work the datasets we deal with every month. ETL is only one part of the picture, though, so with that in mind let’s zoom out and look at some of the options out there for data pipelines.
Tech vendor IBM defines a data pipeline as a method in which raw data is ingested from data sources, transformed, then ported to a data store. The ETL tools and methods we’ve talked about are a key component of a data pipeline, but as data volume and complexity grows, you will increasingly feel a need for a tool to organize, orchestrate, and perform your ETL tasks.
When Doug’s development team needed a job runner for a recent project, they landed on Sidekiq. Sidekiq is a solid job processing project with a lot of relevant features for creating a data pipeline. It runs tasks asynchronously, pulling jobs from a queue stored in a Redis data store. Notification and complex error handling are all supported well. Here’s a screenshot of the Sidekiq web UI.

The project was a success and Sidekiq did everything they wanted it to. If you use Ruby, and your tasks are mostly independent of each other and don’t require modeling dependencies, Sidekiq is a good fit for organizations at many sizes.
A more robust feature set is found in the Mara project. It’s a loose set of Python libraries implementing many data warehousing features. Mara core modules provide access control, schema management, ETL tools, and pipelines. Along with a target data store, it’s potentially a complete solution for an organization’s data. Unfortunately, Mara doesn’t come with a lot of documentation. It’s pretty tough to build a working local copy of the Mara example system without reading Mara source code. Mara’s Github page has lots of activity and this code is clearly widely used, but adopting it requires a significant investment of technical capacity.
For Doug’s use case, and maybe yours, Spotify’s Luigi project comes pretty close to the sweet spot. It’s a lot more robust and widely-used than Mara, and has features that Sidekiq lacks. Crucially, Luigi models workflows as directed acyclic graphs (DAGs), which allows for structured workflows with dependency management.
Doug built a Luigi demo you can find in this GitHub repository. The demo uses Luigi to run a short workflow of dependent tasks and populate a local SQLite database from multiple sources.
The scenario for the demo is a company that needs to compensate its employees for expenses incurred in travel across North America. There is a CSV containing a data set of random names and synthetic expenses in different North American currencies in the repository.
The public data source for exchange rates in this demo is the Bank of Canada Valet API. It’s a really rich service with tons of useful data, including daily exchange rates.
The demo is contained in a Docker container that starts up the Luigi Central Scheduler when the container is started. It’s configured to expose the Luigi service’s web interface, which provides a web interface for monitoring current and recent jobs.

Luigi doesn’t itself schedule task execution, which may sound surprising since we’re talking about the Luigi Central Scheduler, but the service is concerned with scheduling the execution of tasks within workflows, not with firing off workflows. For that, the Luigi people recommend writing your own service or using an operating system scheduling facility like cron.
The demo is configured with three tasks;
- FetchRates loads exchange rate data
- ImportExpenses loads expense data
- GenerateReport generates a report
GenerateReport depends on ImportExpenses, which in turn depends on FetchRates.
In the container, running the main Python script adds a GenerateReport task to the Luigi scheduler, which then fires off the other two tasks in turn to satisfy the dependencies of GenerateReport.
Luigi’s scheduler determines whether a task is complete or not by checking whether its output exists. If the output is already in place, Luigi won’t start the task. In the case of the demo, a report CSV is the output of GenerateReport.
There’s more detail in the demo README file. Check it out, we hope you find it useful.
Creating a Dashboard in Power BI:
By Rashmi Krishnamohan
As a data analyst, I work with a variety of tools, but Power BI is my go-to. Why Power BI? It’s simple—it allows me to tell a story with data. Instead of staring at endless rows and columns, Power BI turns those numbers into interactive, engaging visuals. It’s like giving the data a personality, making it easier for users to explore, understand. Plus, it keeps things fun—because let’s face it, if you can make data interesting, you’ve won half the battle. Even if someone has never used Power BI before, they can quickly get the hang of it and dig into the data themselves.

For the dashboard I created for this podcast, I downloaded the Data Science Salaries dataset from Kaggle—a fantastic resource when you want to get your hands on real-world data for practice or portfolio projects. The dataset includes fields like:
- Work Year: The year of the salary data.
- Experience Level: Junior, mid, and senior and executive level professionals.
- Job Title: From Data Analysts to Data Scientists to Data Engineers (and many more..)
- Salary in USD: Standardized salary values for easy comparison.
- Company Location and Employee Residence: Where the jobs are based and where employees live.
- Remote Ratio: How much of the role can be done remotely.
- Company Size: Whether the company is small, medium, or large.
Anyone who works with data knows that it’s never clean straight out of the box. This dataset was no exception—it had missing values, duplicate entries, and some inconsistencies in how fields like experience levels and company locations were recorded. That’s where Power Query Editor comes in.
Power Query is one of my favorite features in Power BI because it’s like having an inbuilt toolkit for cleaning and transforming data. I used it to remove duplicates, handle missing values, and normalize some of the abbreviations. What’s nice is that all of this happens within Power BI, so you don’t need a separate tool to clean your data. Once it’s transformed, you can jump right into building your visualizations.
In my day-to-day work as a data analyst, Power Query is a lifesaver when dealing with large datasets that need wrangling before I can even start analyzing them. Plus, if I need to export the transformed data from Power BI, I can easily use DAX Studio to push it back into a CSV format.
Building the Dashboard:
After cleaning the data, I got to the fun part—building out the dashboard. One of the things I love about Power BI is how versatile it is in terms of design and functionality. Here’s a rundown of some key elements I included:
- Slicers: I added slicers to allow users to filter by year and experience level. This makes the dashboard dynamic—whenever someone selects a different year or level of experience, the entire dashboard updates to show relevant data. It’s an interactive way to explore trends and comparisons.
- KPI Cards: I used KPI cards to display high-level metrics like average salaries, highest and lowest salaries, and year-over-year comparisons. These cards give users a quick snapshot of the key data points they’re likely to care about.
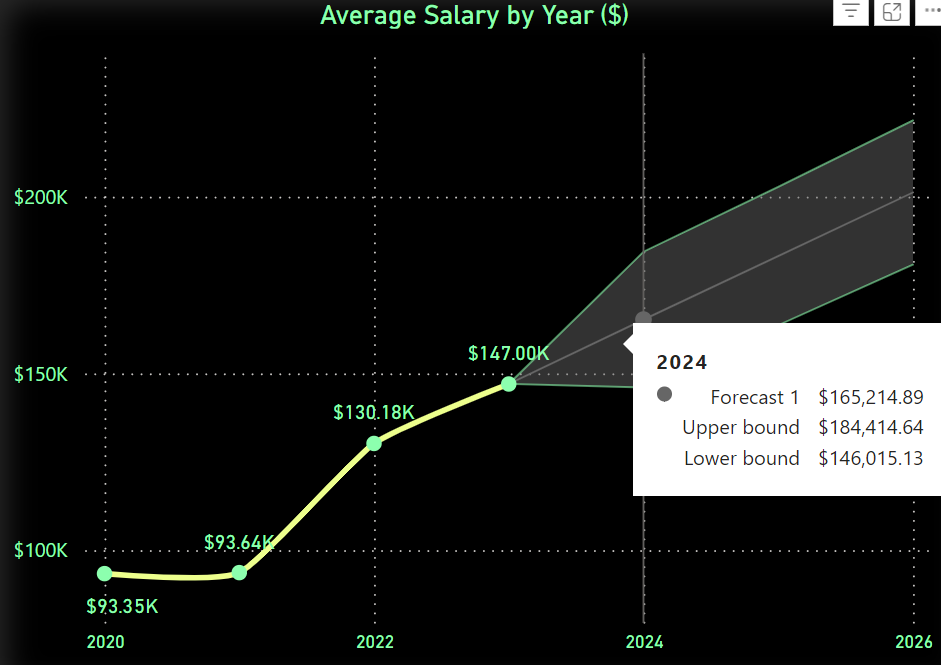
- Salary Forecast: One of the cooler features of Power BI is the built-in forecasting function. For the salary data, I created a line chart that not only shows past salaries but also forecasts future trends based on historical data. This is a great feature when you want to project potential future outcomes, and it’s surprisingly easy to set up.
- Top 10 Jobs by Salary: I always like to give users something to rank, so I included a chart that highlights the top 10 data science job titles based on average salary. It’s interesting to see which roles are leading the pack and how salaries differ across positions.

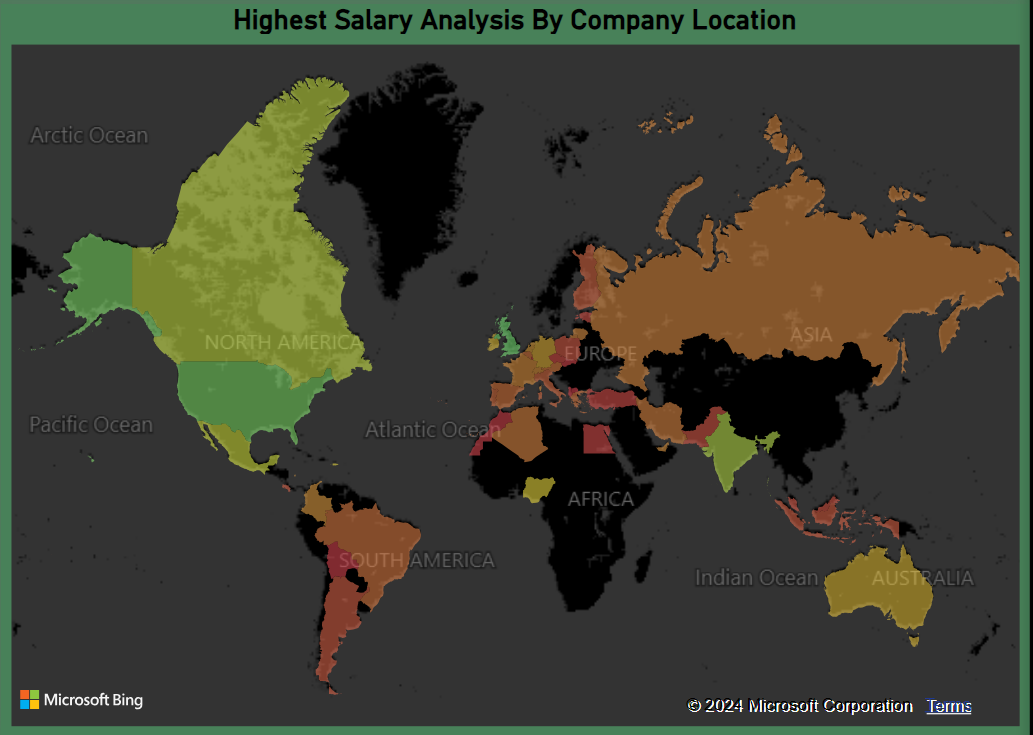
- Maps: (Why Maps? Because They’re Awesome)
I also included a map visualization in the dashboard. Now, I’ll admit—I’m a bit biased toward using maps in my dashboards because they look amazing and are incredibly useful for visualizing data geographically. In this case, I used a map to show salary distribution across different regions, using a color gradient to make it visually appealing and easy to understand at a glance.
I took it a step further by using bookmarks to create different map views. So, you can toggle between maps showing average salary, highest salary, and lowest salary—adding even more interactivity to the dashboard.
Feel free to explore the dashboard yourself here.
10 επεισόδια